Events, Logs, and Metrics of Projects
To access descriptive details about the state of your Projects, open up any active Project and locate the Events, Logs, and Metrics buttons. With their help, you are able to locate any potential problems that might be happening within your clusters.
Events
You are redirected to Events, where you can see all Kubernetes changes made in a Project. To preview details click each action use button. A green strip indicates a successful action, and a brown strip indicates a failed action.
You can sort Events by:
- Search field
- Filling Start and End Date
- Tick Only failed to filter failed actions
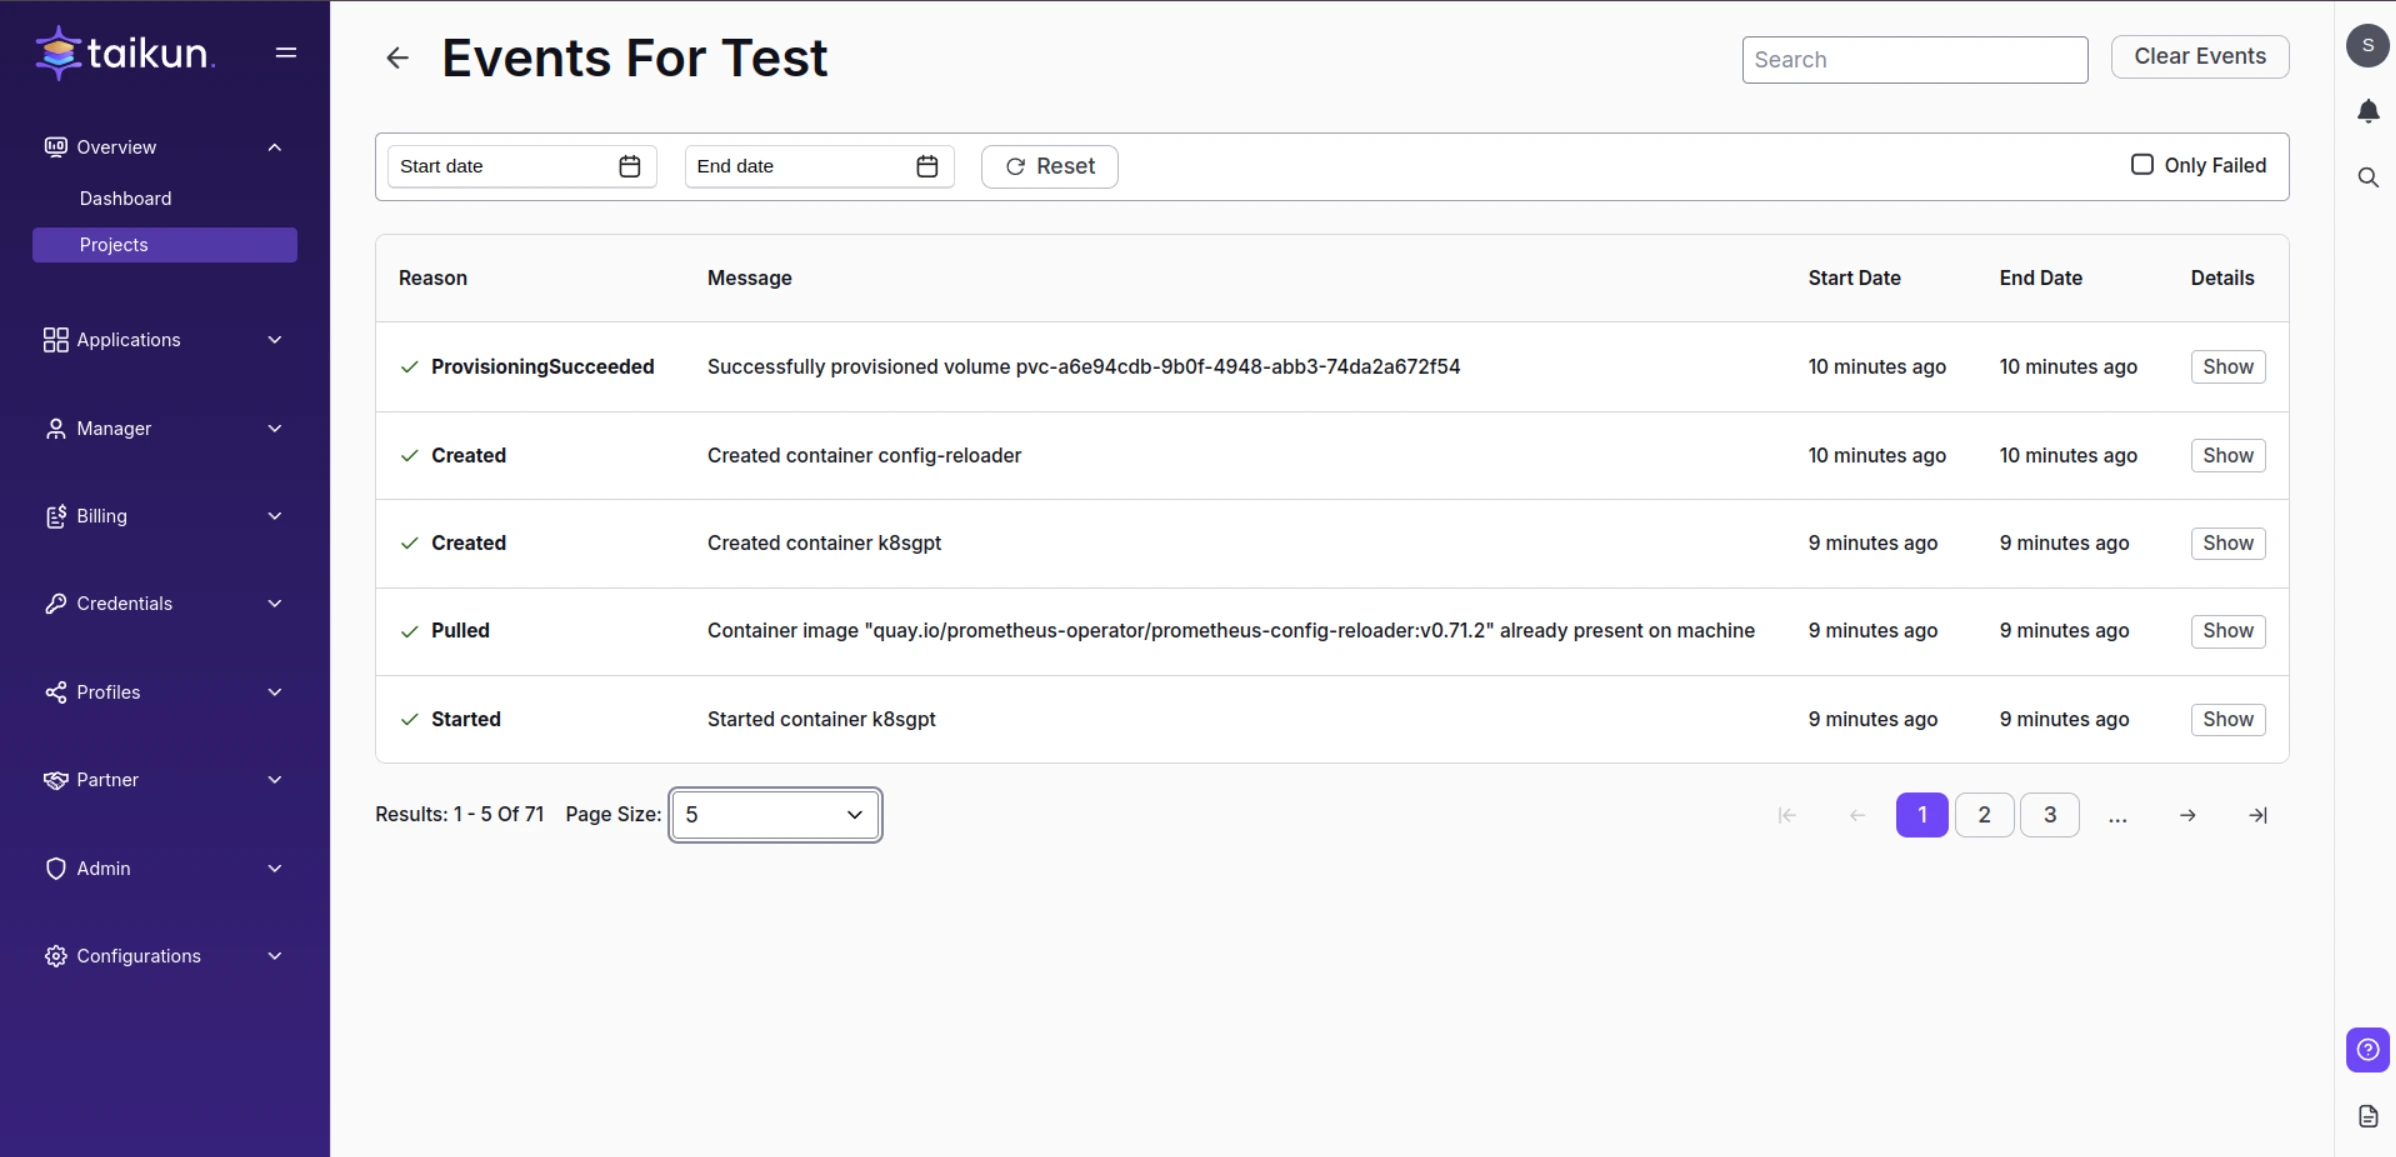
Project events
Logs
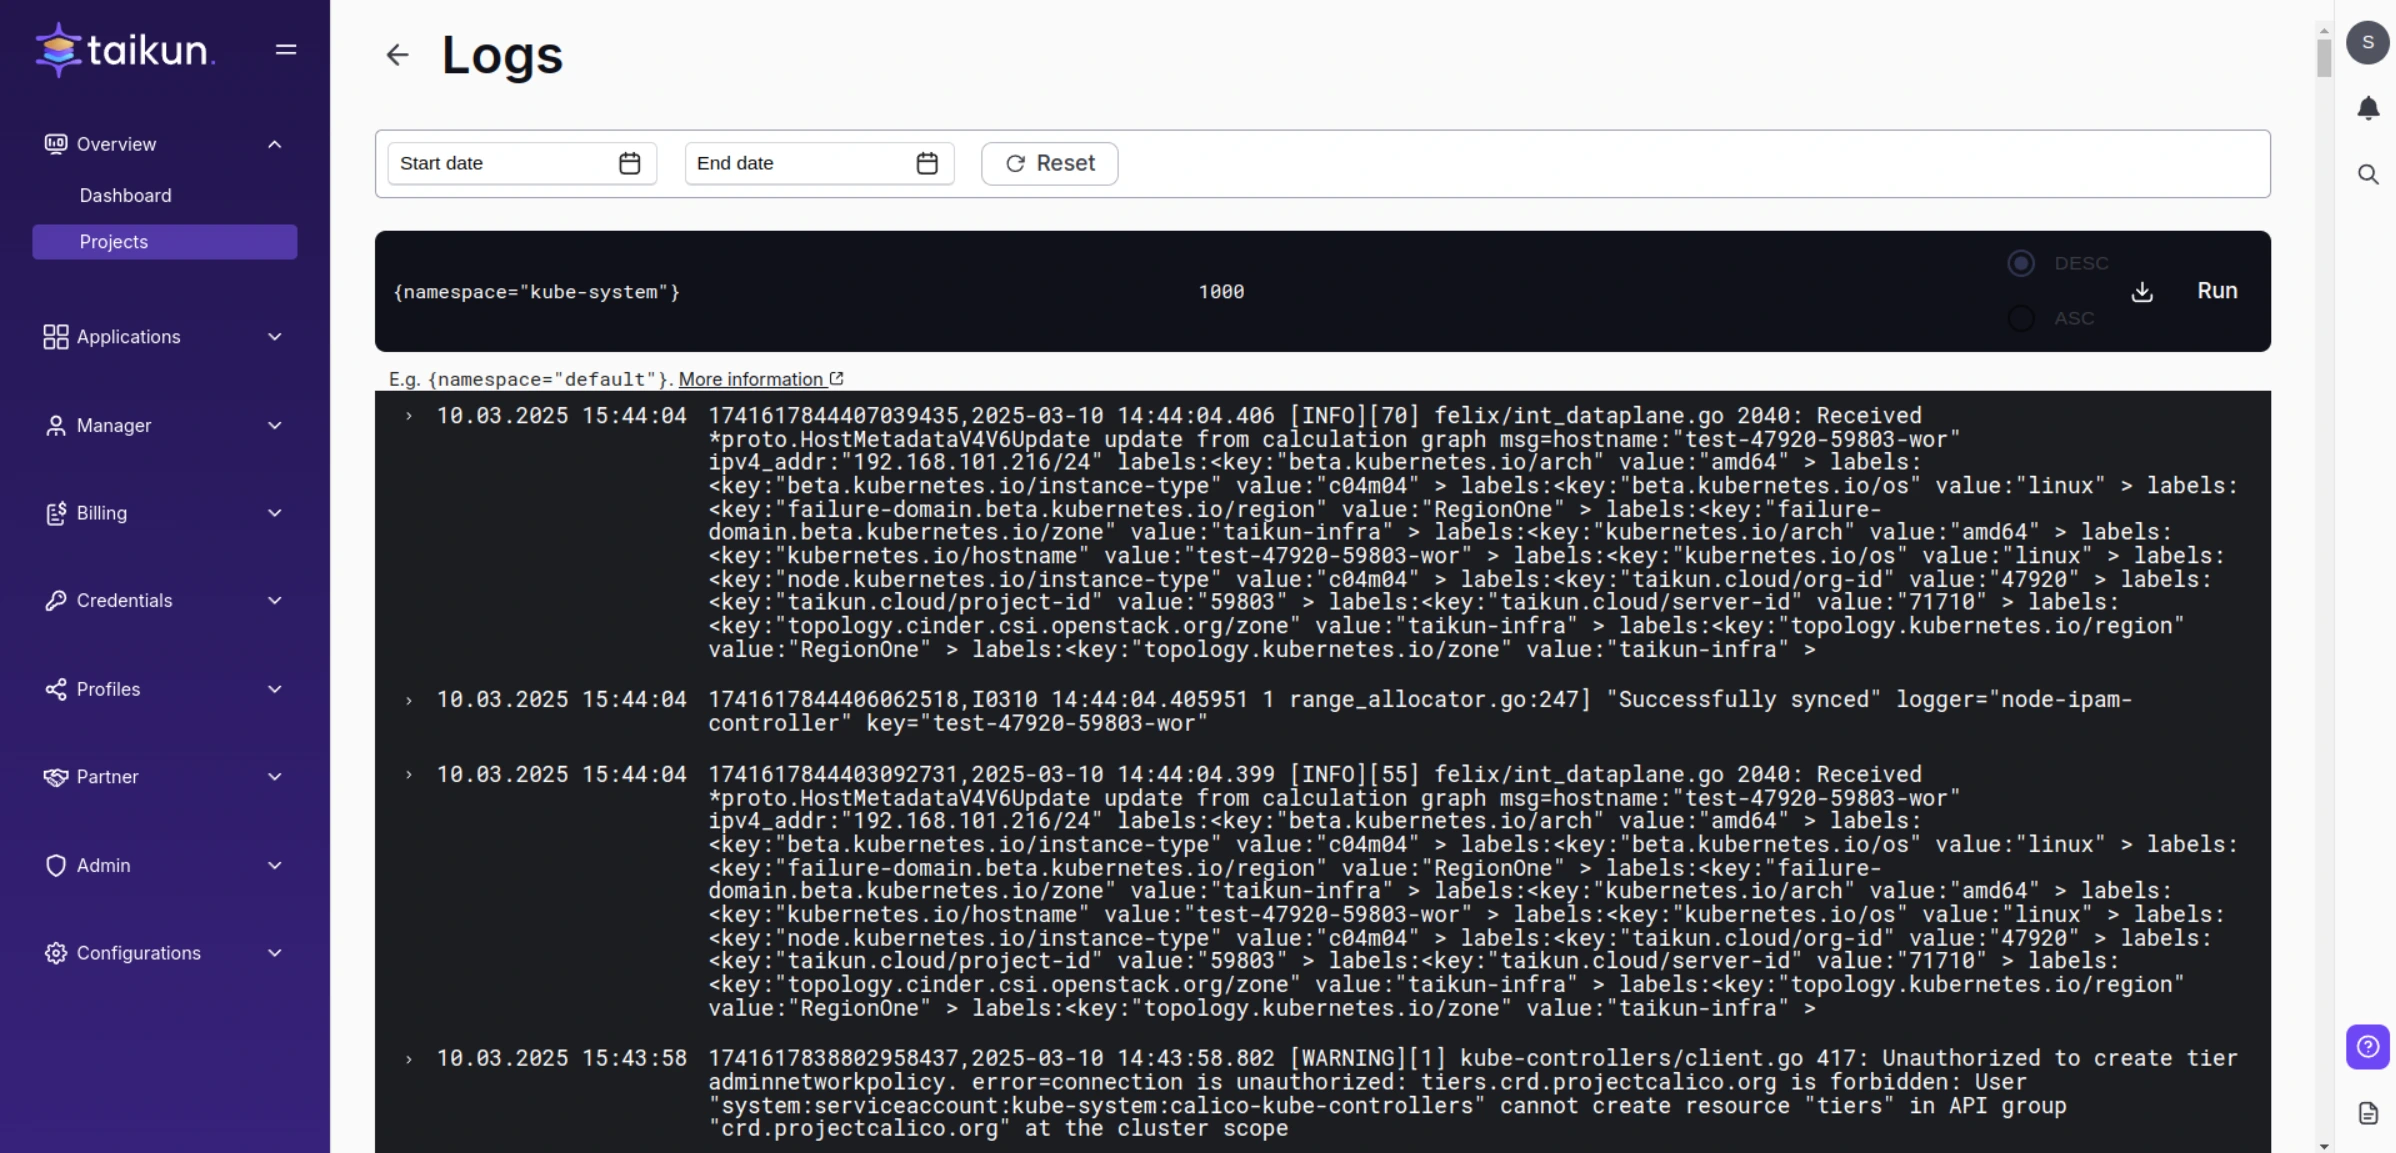
Preview Kubernetes cluster logs to Grafana.
Logs button is disabled if Monitoring is disabled. To view logs, you must first Enable Monitoring.
Logs
Info
Write your query and use Start date and End Date for sorting. You can also expand every message – red is an added action, without color is other log.
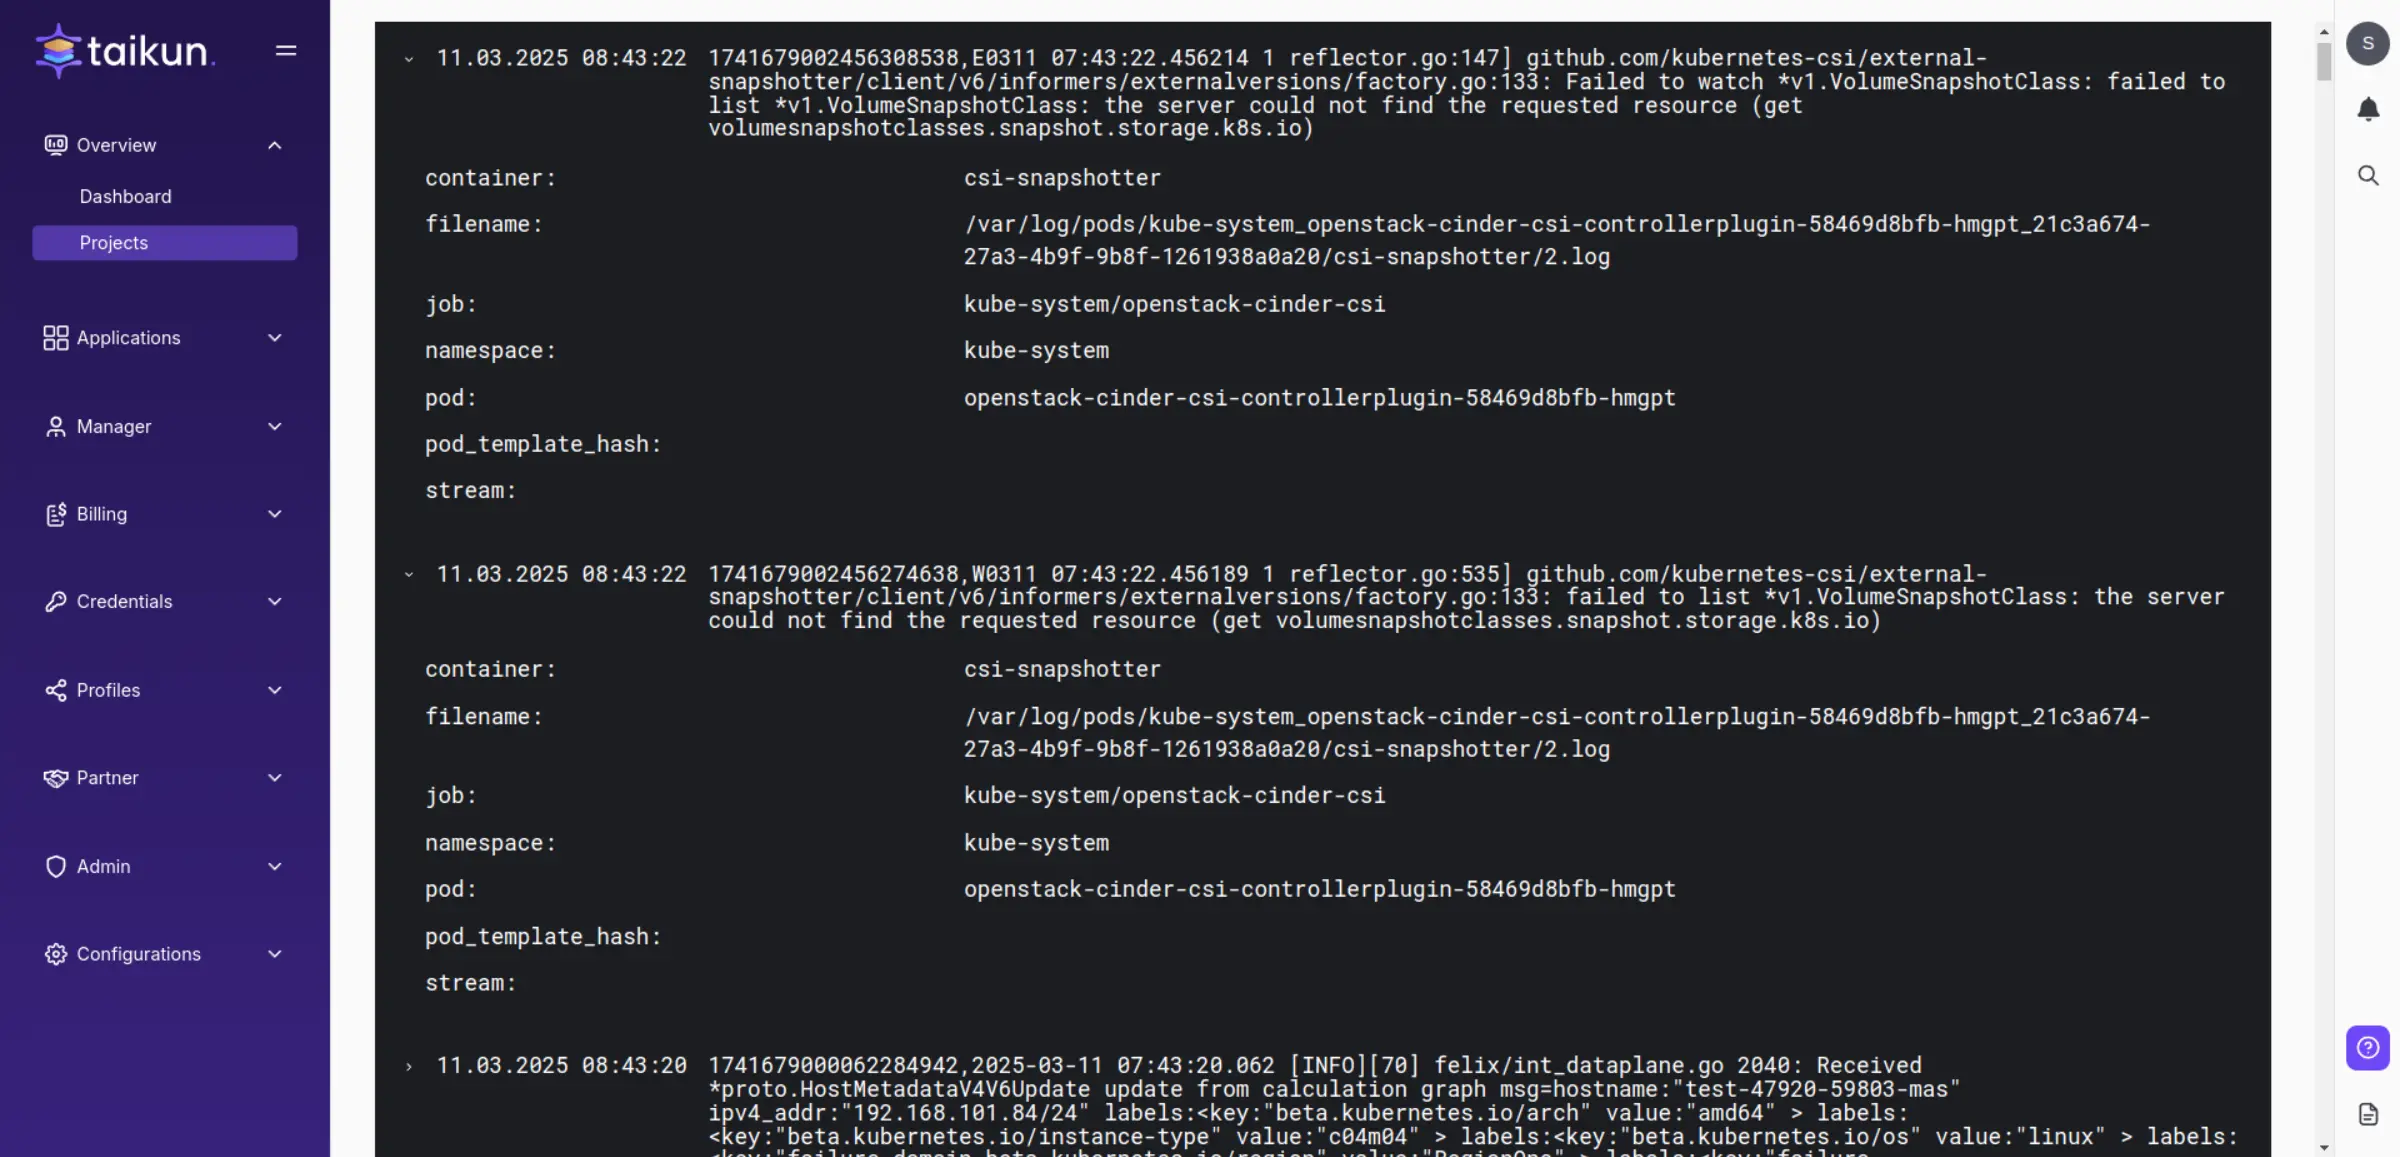
Detailed logs
Alerts
The first thing you will see when you access the Alerts menu is Firing Alerts. This section is refreshed every 5 minutes, but you can also use the refresh button to see the most updated data.
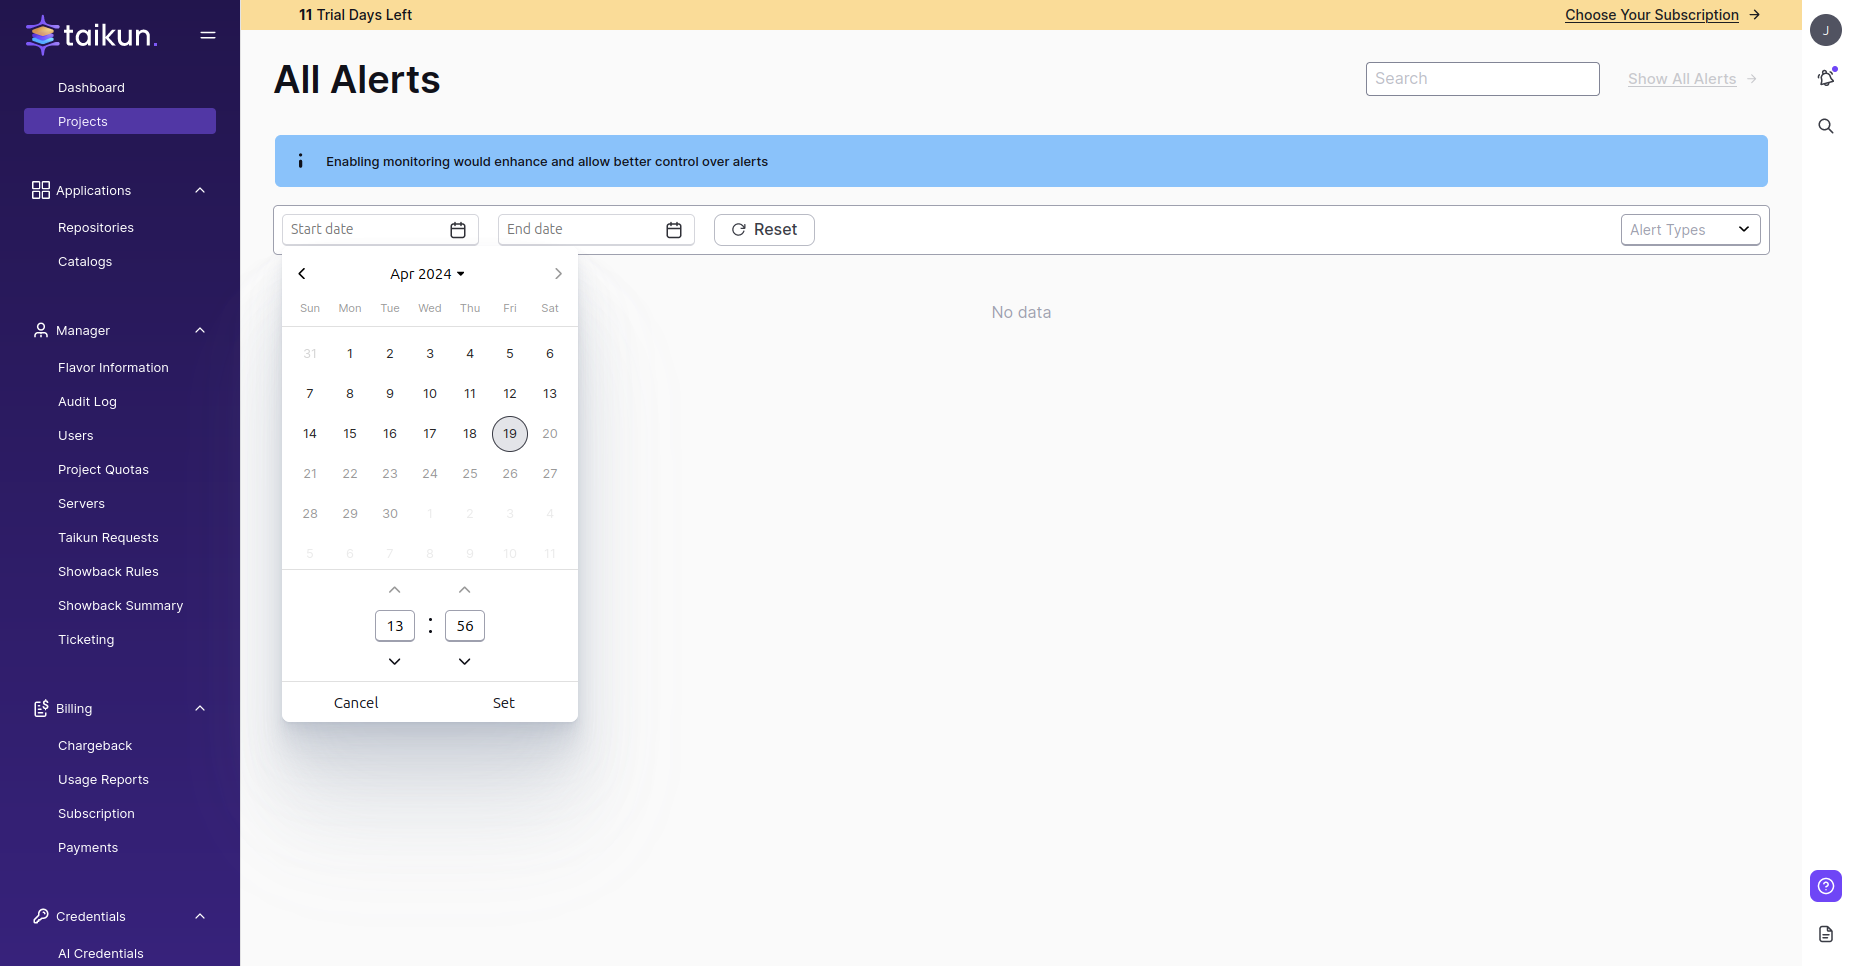
Alerts
To see all alerts, use the upper right Show All Alerts button. As seen above, firing alerts are marked with red color.
You can silence alerts and sort all the alerts by firing, silenced, all, or resolved.
Alerts are accessible only if Monitoring is enabled and the project is not empty.
For each alert, you can see details and use a link that will redirect you to Metrics with the query already filled.
The index number at Alerts shows the number of firing alerts. When the firing alerts are resolved, the number disappears.
Firing alerts also work from the real-time notifications bell in header.
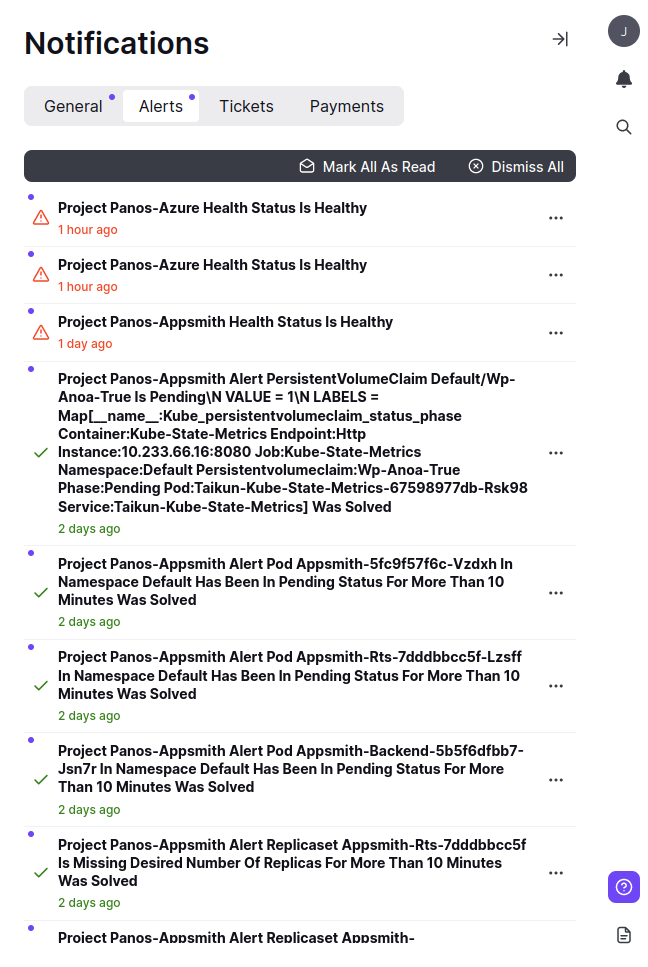
Notifications
The notification contains a brief message on a specific Project and an exact time of the change of an Alert. After clicking Show Project, you can access the project in which the alert is.
Metrics
Write a query, search Prometheus Metrics and preview the value needed.
Modify Step or Date.
Switch between Console and Graph for better results.
Metrics